
Back in 2021, when I initially considered a wind turbine, and actually purchased a FuturEnergy AirForce-1 (which has now been acquired by Britwind), I had to find out that financially it really did not pay off to have a micro turbine. Plus, the turbine did not fully convince me, if it could really handle the high wind speeds here in Caithness.
Here is a rough estimate of the energy production and consumption per 24h of the FuturEnergy AirForce-1 for our location at 10m tower height:
As we can see, the turbine does not even come close to what we need. In addition, it cuts off at roughly 11m/s and has a survival speed of 52m/s. So, especially in the winter months when energy is needed most, chances are high that the turbine cuts out and -worst case- breaks if we do not lower it beforehand. This is an additional a nuisance, as lowering the tower is quite an undertaking (taking away all guy lines).
So it is clear, we need something bigger – since “more is more” (the Muldoon principle).
After looking around what works in the Highlands and Islands and what actually got a positive planning decision, I came across two options in the 5kW range:
- Britwind H5
aka ISKRA Evance R9000 - Ryse Energy E5-HAWT
What both turbines have in common:
- delivery of around
5kWpeak power (at11m/s) - cut-off and survival speed
60m/s+ (218km/hor134mph)
Though the E5 seems to produce energy at lower wind speeds, it seems the H5 is more efficient at higher wind speeds. Here is some data I got from their spec sheets:
| Average wind speed | Britwind H5 | Ryse Energy E5 |
|---|---|---|
| 2 | 0 | 290 |
| 3 | 0 | 1900 |
| 4 | 4963 | 3900 |
| 5 | 9167 | 6900 |
| 6 | 13653 | 10000 |
| 7 | 17877 | 14300 |
| 8 | 21581 | 17700 |
| 9 | 21581 | 20000 |
| 10 | 21581 | 22500 |
| m/s | kWh p.a. | kWh p.a. |
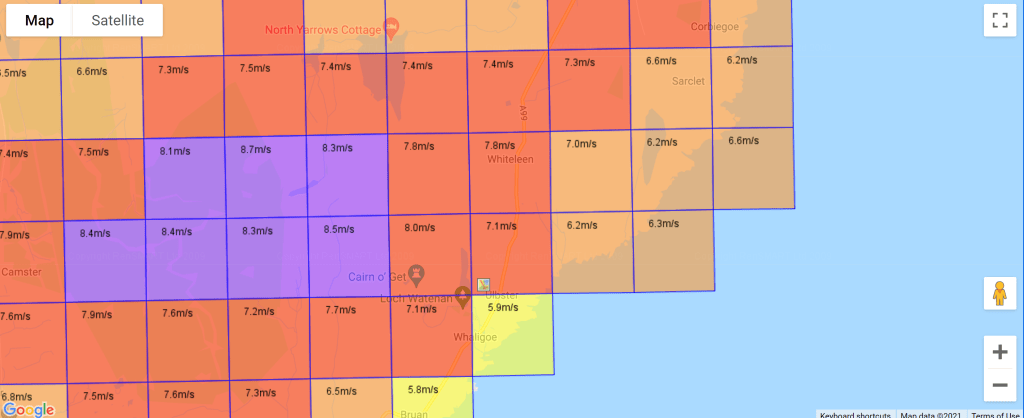
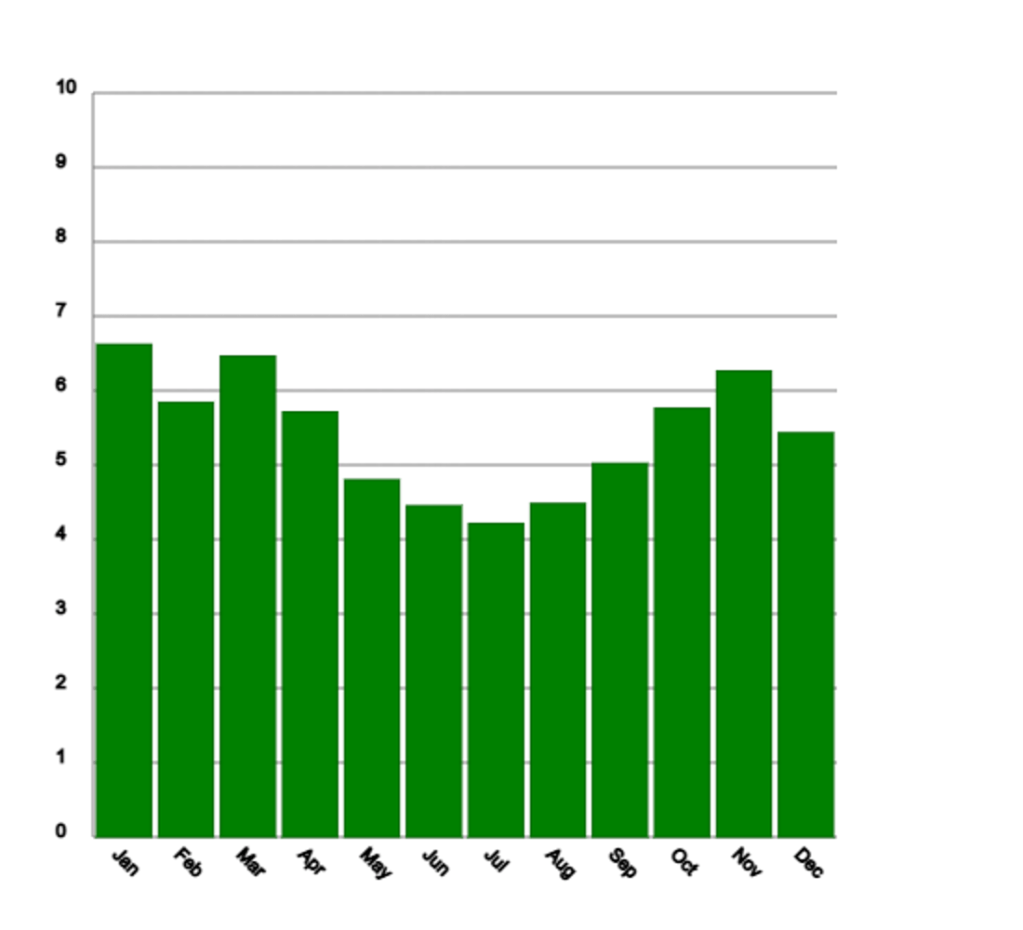
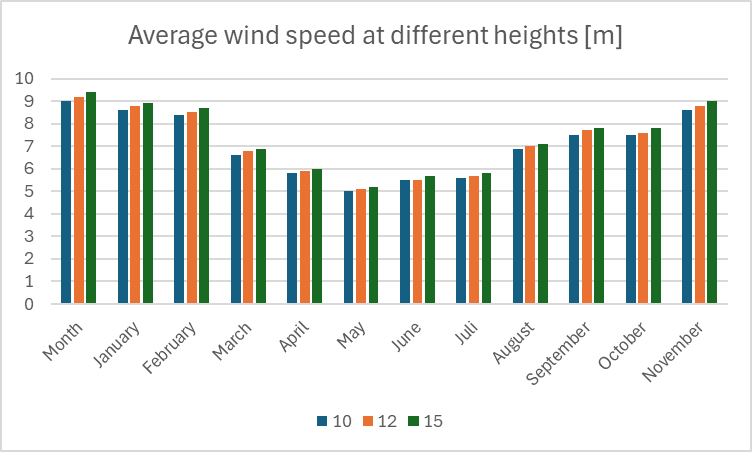
The NOABL wind speed database classifies our location as 7.1m/s (yearly average at 10m) and their report shows the follwoing information at 10m, 12m and 15m height over the year:
| Month | Height 10m | Height 12m | Height 15m |
|---|---|---|---|
| January | 9.0 | 9.2 | 9.4 |
| February | 8.6 | 8.8 | 8.9 |
| March | 8.4 | 8.5 | 8.7 |
| April | 6.6 | 6.8 | 6.9 |
| May | 5.8 | 5.9 | 6.0 |
| June | 5..0 | 5.1 | 5.2 |
| July | 5.5 | 5.5 | 5.7 |
| August | 5.6 | 5.7 | 5.8 |
| September | 6.9 | 7 | 7.1 |
| October | 7.5 | 7.7 | 7.8 |
| November | 7.5 | 7.8 | 7.8 |
| December | 8.6 | 8.8 | 9.0 |
| avg m/s | avg m/s | avg m/s |
Compared to each other this does not look too dramatically different. But the power being generated increases in a cubic order with doubling wind speeds.
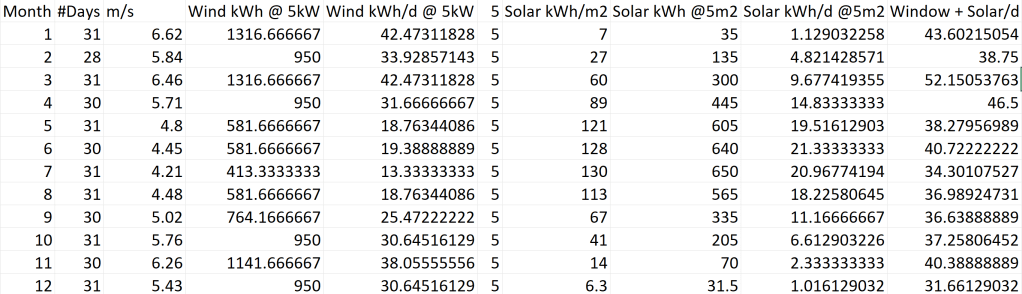
So, when I correlate this information with different turbines to our location for a 15m tower height I get the following data:
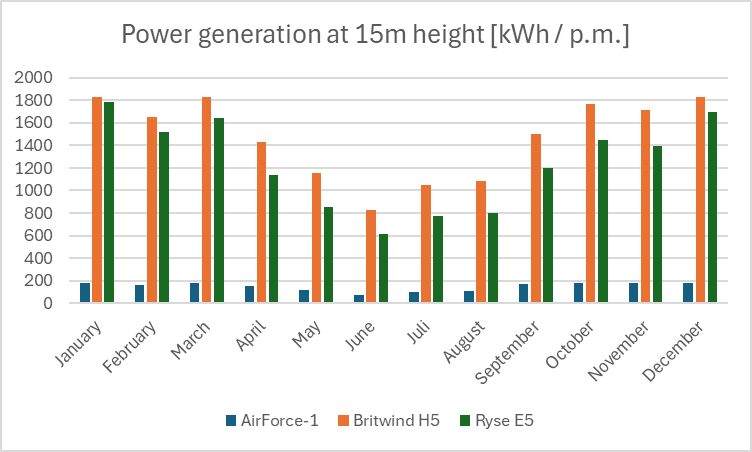
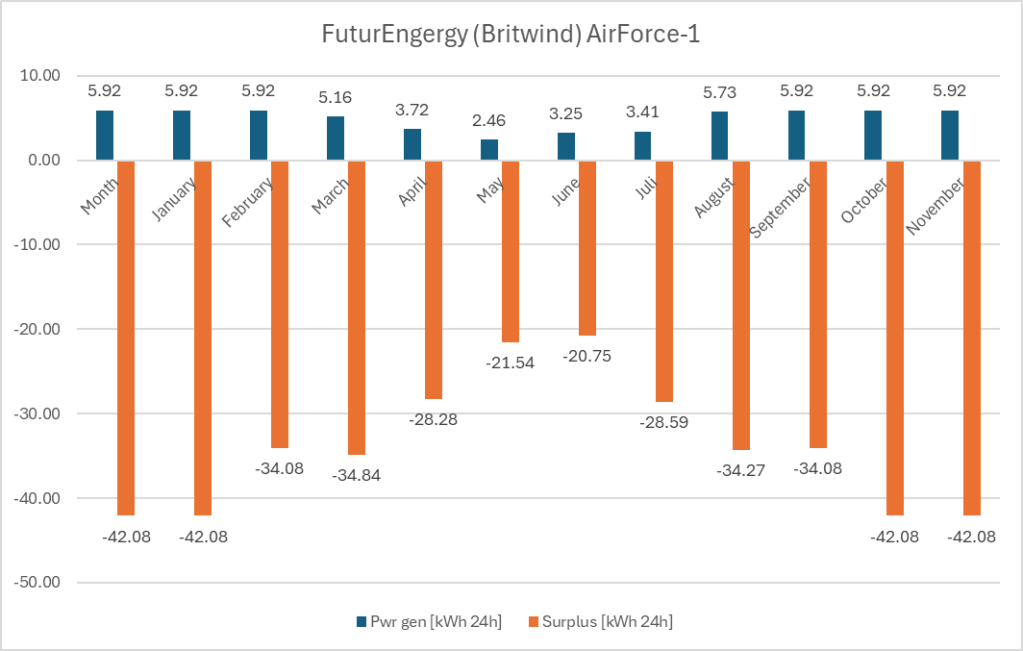
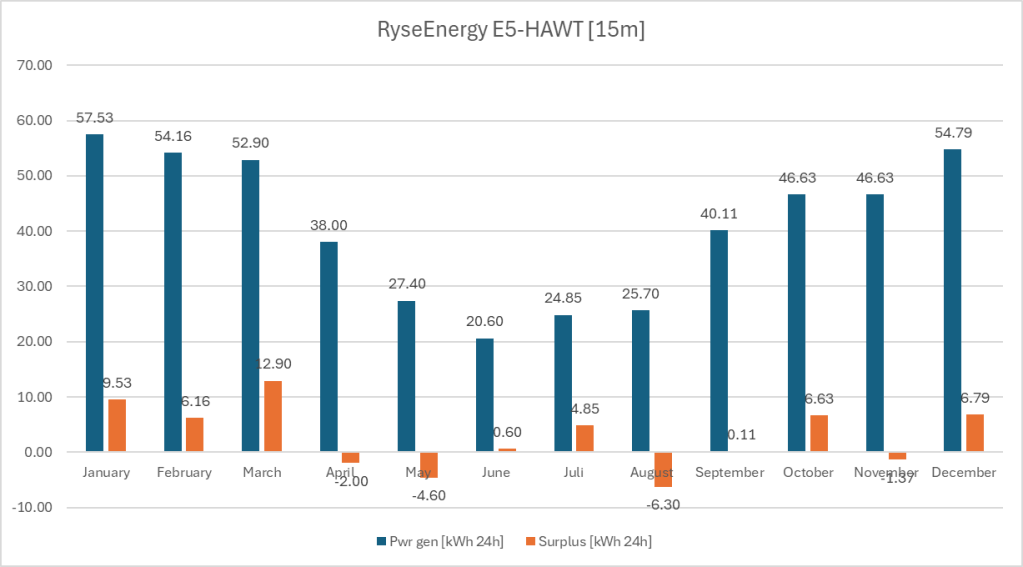
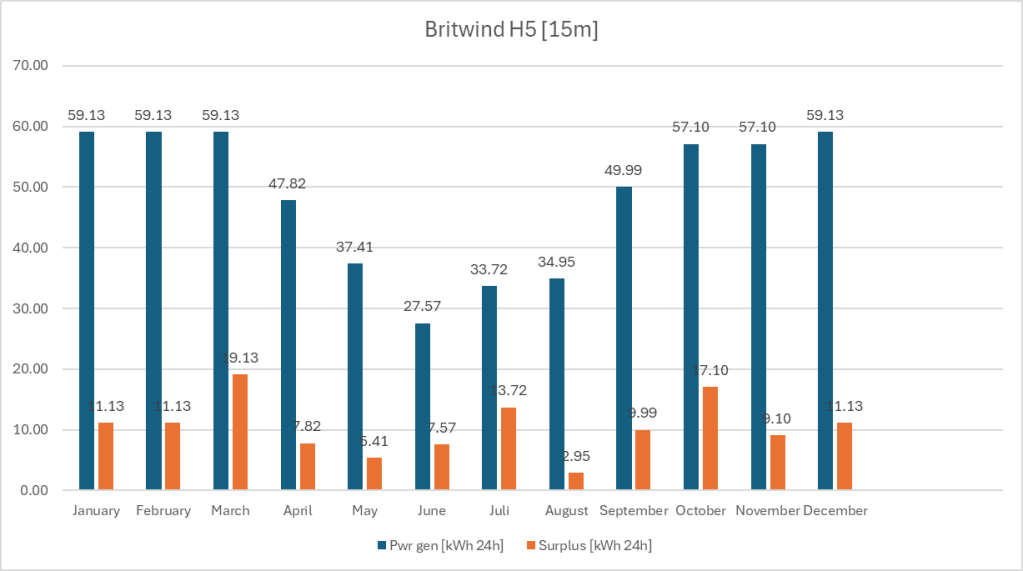
But it becomes more interesting when we compare generated versus required power per day over each month.
Here we see that during the winter months generated power seems to be the same (or capped) at just below 60kWh per day. And it also seems that we have a surplus every month (the orange bar is the power required per day).

And if we now show the surplus/deficit power vs power generated we see that the E5 cannot always produce the required amount:
From this we can see the following problems:
- The E5 will not be able to deliver the amount of energy on its own for over
4months and barely only during half of the year. During summer we can compensate that easily with PV if we so like.
Hiwever, for winter months this can become harder to achieve. - For the H5, the average surplus of power is quite small in August, so chances are high we have to top up as well (easy in August with PV).
- Based on the current “capacity” of our batteries (
86kWh) and the little amount of surplus energy in the darker months, it is quite probable that we run out of power (regardless of the brand).
To illustrate the last point, we have a look at the battery runtime based on our battery “capacity” and required power per day. For a third of a year the runtime is below 2 days. And for half of the year it is below or just over 2 days. Only in the two brightest months of the year we have a runtime of over 4 days.

So, it only needs a short period of calm to run out out of power. Of course, there is a solution to it. Actually, more than one:
- Use less energy (such as not to wash for a day when SoC is low).
- Use solar to help out (also works in darker months, see our calculation here).
- Use diesel (we still have and always will have the backup generator).
- Use a bigger battery bank (such as
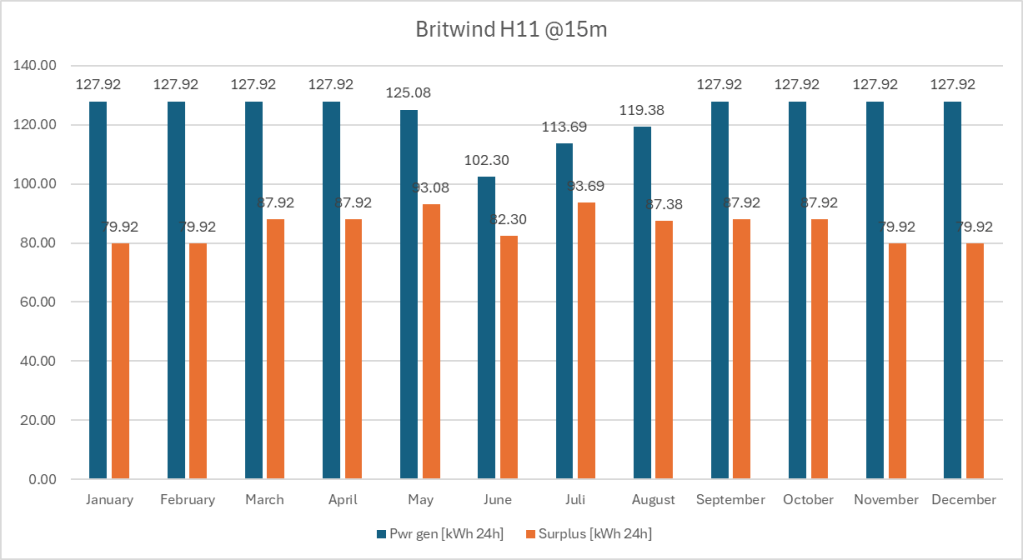
10batteries with144kWhthat would give us a runtime of three days). - Use a bigger turbine (see below for a power generation with a Britwind H11) –
again: Iain knows – “more is more”.
Britwind Desk Assessment
My above values differ quite a lot from the desk assessment that Britwind prepared for me. For the same turbine and tower height they predict a much higher energy prodution:
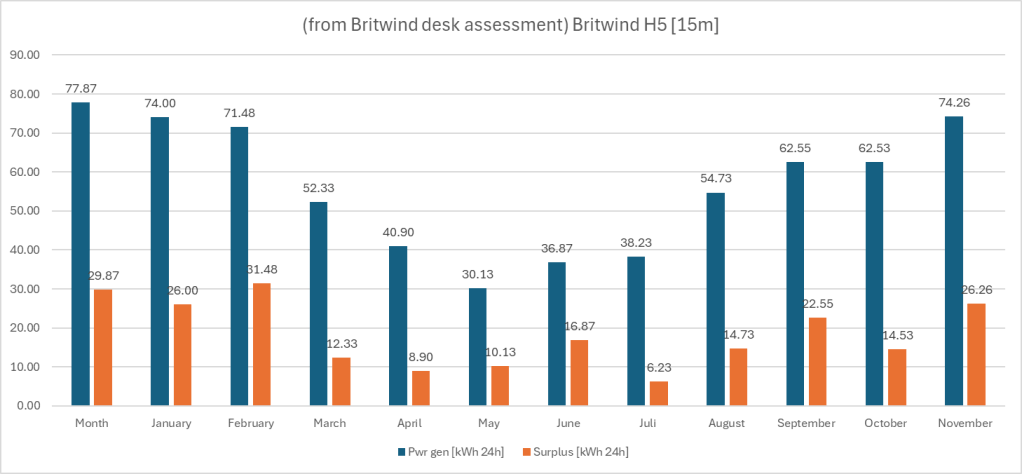
If these values were to be achieved, we are less likely to run out of power. Of course, with no wind at all, we still run out of power after exactly the same time. But chances are much lower.
But I rather use my values and be positively surprised if actual generation exceeds my prediction than the other way round as in relying on wrong numbers and have too little energy.
A bigger turbine?
When going for a bigger turbine such as the Britwind H11 we would have excess power so it became unlikely to ever deplete the batteries. We could probably even shrink the size of our battery bank. Or we could run a Bitcoin miner with the excess energy. But, I find that quite a waste. Plus, the bigger turbine is much more expensive, heavier and needs more maintenance (read: even more expensive).
Price and Cost Estimate
When I looked online to get an indication for the price of turbines, I found sources that stated arounf 23'000 GBP for a Britwind H5. The estimates I was given by Britwind range from 35'000 GBP to 45'000 GBP (and optionally a 700 GBP p.a. service contract).
I will have to see what (electrical) components I already have that I can reuse and what works I can do myself (such as preparing the ground) in order to reduce the total cost.
To buy the energy needed (13844kWh p.a.) from Scottish Power I would have to spend nearly 3'000 GBP.
And to produce this from my Diesel generator I would need roughly 4'250l of Diesel and thus spend about 3'250 GBP.
With a turbine lifetime of maybe 20 years, I still do not think this really pays off – unless, of course, fuel prices righ considerably. However, wind power seems to me much more environment friendly (not only compared to Diesel but also to PV).
Conclusion and Next Steps
So, the next step in my evaluation is to get more technical and legal information and requirements about the turbines (such as output voltages, approved electrical eqipment, required permits). Do they work in an off-grid environment – and, if yes, how? How can control our complete electrical system to avoid overchargin, and have safeties and fallbacks in place? I will find out.
And this is it for today.