We finally did it and decided to get a PV system for our barn. Though we had been thinking about this since we started building on our plot, it never seemed to really pay off. A solar installation in very north of the Highlands?! But with prices for PV modules falling and falling I did another “business case” to see where this would land.
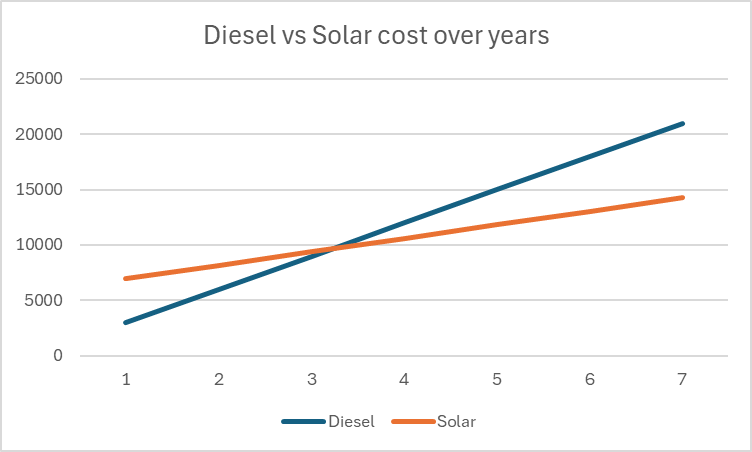
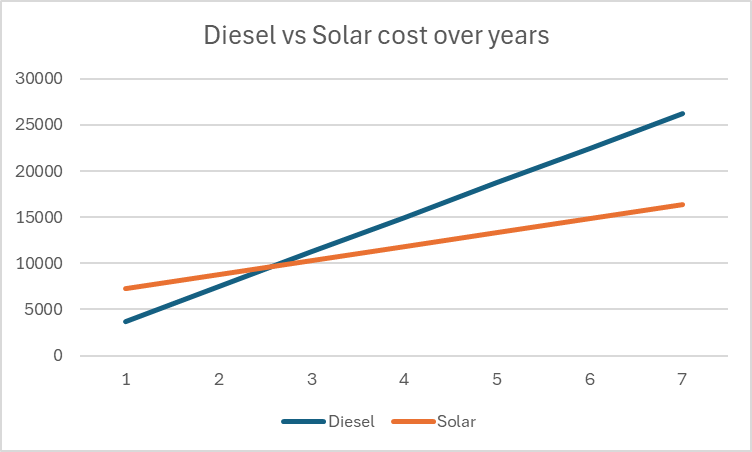
In the following figure you see the condensed outcome. In 38 months we would “break even” and roughly save over a 950 GBP per year over the course of seven years.
Selecting Modules for the Roof
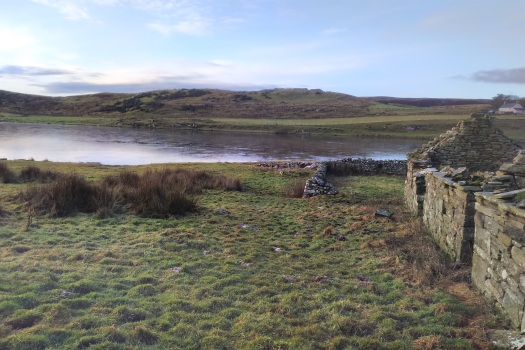
But first, let me begin from the beginning … for the last two years our JCB G20QS backup generator has been sitting outside in the rain and collecting not dust but rust – that is why we decided to build a small shelter on the south end of our barn. Once we finished drawing the shelter with its 36m2 roof, we thought that a south-facing roof would be perfect for collecting solar energy in the summer. Remembering my last calculation, I knew that the slope of the panels for winter and summer time differed dramatically. That was when we started thinking to place additional modules vertically on the south wall of the barn.
After we realised how much sheet metal for roofing would cost, we looked for for cheap solar modules that could be used as a cover for our shelter. We selected the Trina Solar TSM-NEG9R.28 445Wp module with dimensions of 1762mm x 1134mm x 30mm that would fit well as a roof.
Selecting MPPT Chargers
With the PV modules selected I had to choose between a AC-coupled and an DC-coupled system or a mix between the two. As our system is off-grid and I expected fast-changing workloads in our environment I decided for a completely DC-coupled system.
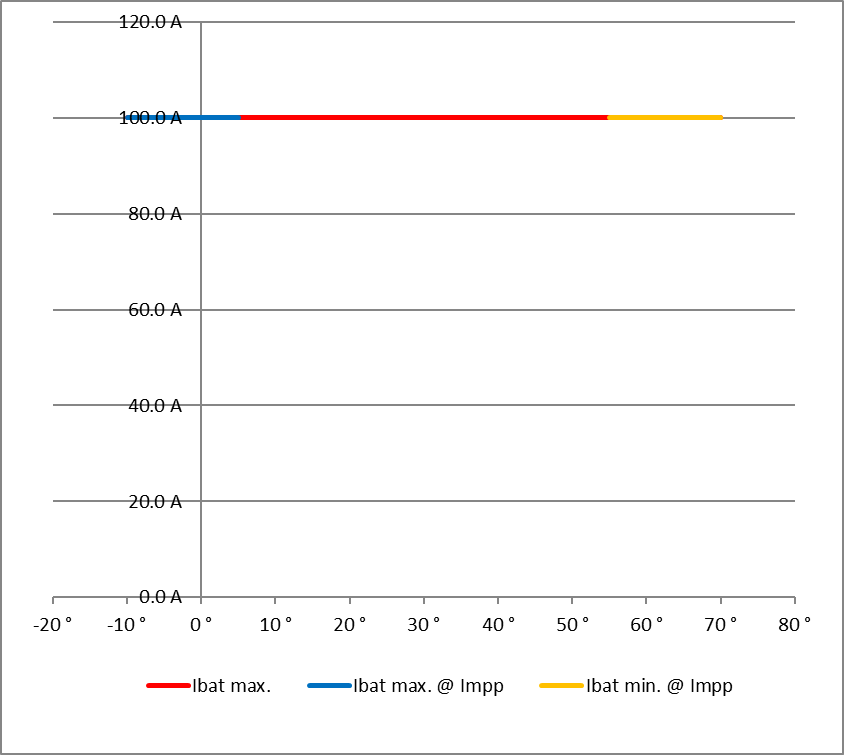
Already running a Victron system, I wanted to use Victron MPPT chargers for the installation. After checking and comparing the prices of different chargers (with a VE.Can or a VE.Direct connection), I started the Victron Energy MPPT Calculator and added my solar panels to it. I then did a couple of modifications to the spreadsheet (by prior removing the password and protection from the sheets) and found the Victron Energy SmartSolar RS 450/100 to be the best choice. With this charger I could fit 7 modules per string in order not to exceed Voc. The power would be limited by over 30A at minimum temperature but I do not expect much sun in the colder months anyway. At max temperature there would also be a cap by roughy 15A but I expect to have large amounts of excess energy during the sunnier months – so need to worry.
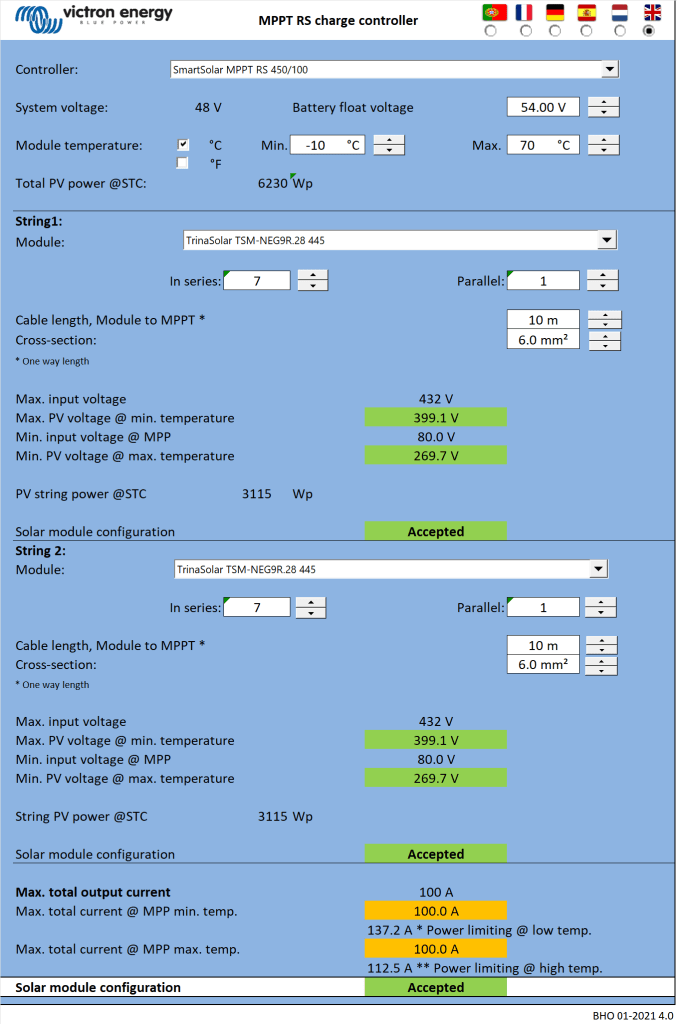

Note1: there seems to be a bug in the spreadsheet version BHO 01-2021 4.0 when using the “MPPT RS” tab. The calculation table uses the selected voltage in cell E15 from the “Blue- & SmartSolar” tab (and not 48V as the only possible voltage for the RS) and from there miscalculates the currents.
Note2: when selecting the number of modules and the diameter of the cabling, the up/down buttons do not seem to work correctly. Typing the values directly into D16, D33, K18, J35 and K35 works around this issue.
Module Placement
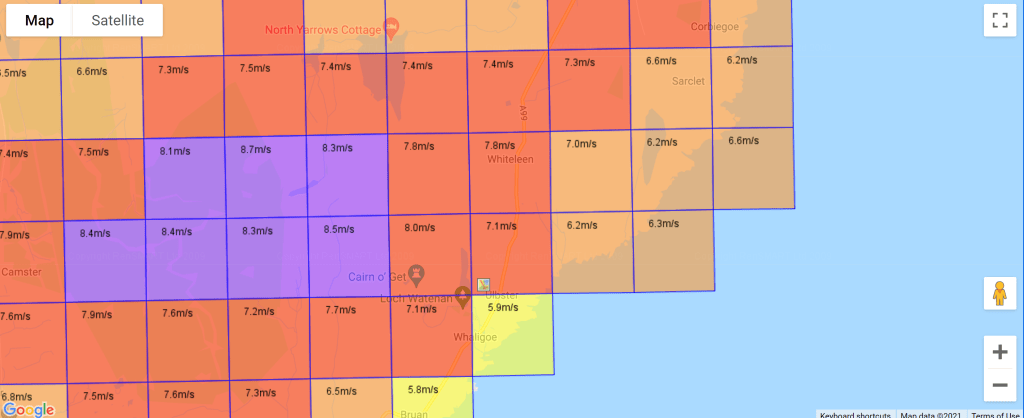
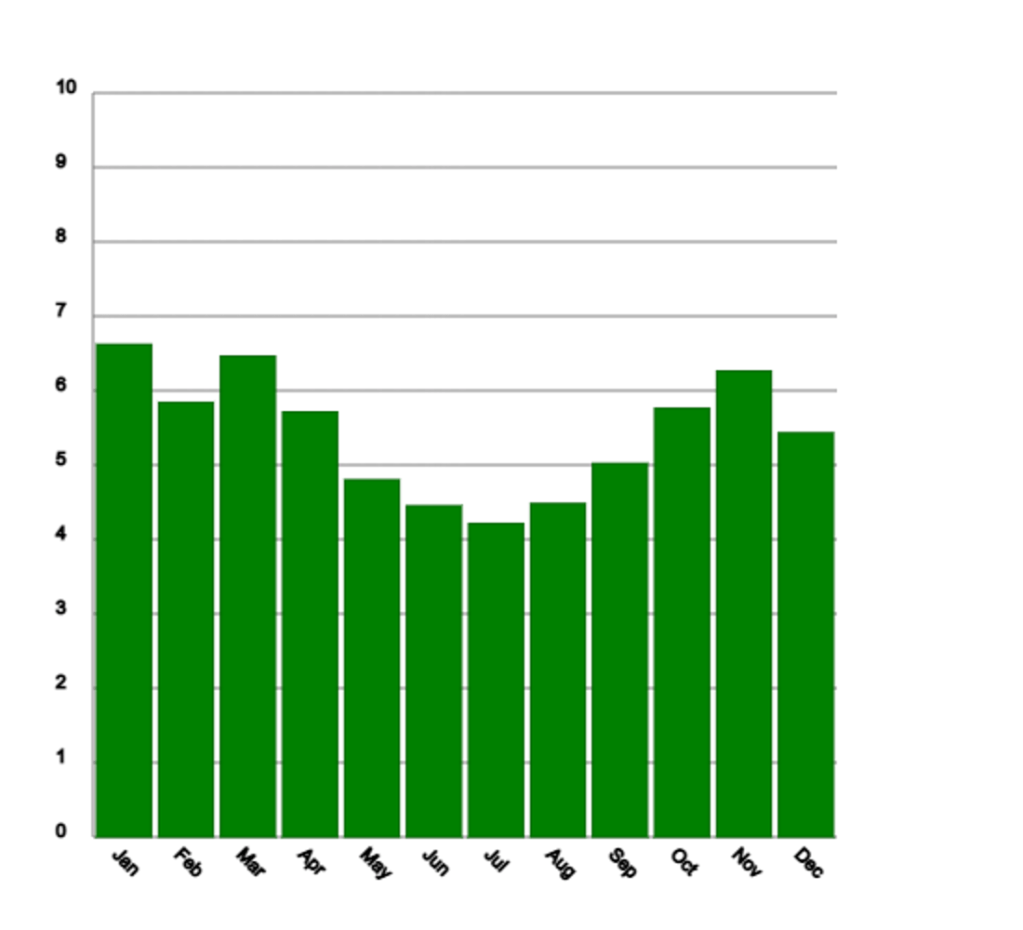
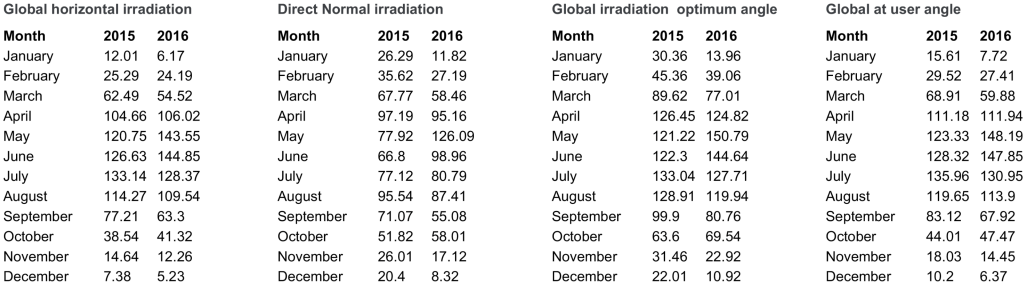
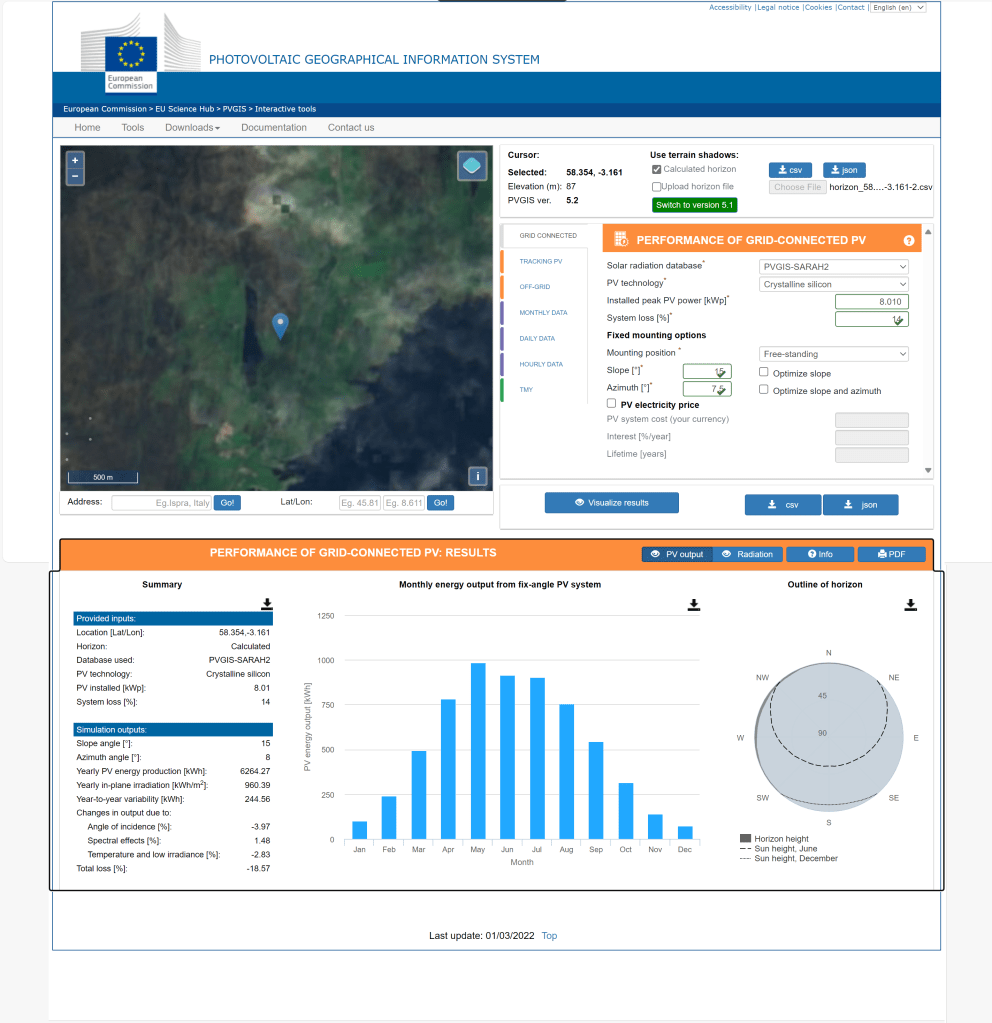
To get a better understanding where to place the modules and what difference it would make, I used Photovoltaic geographical information system (PVGIS) of the European Union (see also my earlier article More Power on how to use it).
After selecting the location of our barn I tried different combinations an panels with these constraints:
- slope of the existing barn is
15° - barn roof can fit a maximum of
28panels - azimuth of the barn is
7.5° - azimuth of the shelter is therefore also
7.5° - maximum slope of the shelter roof is
15°in order to maximise the number of vertical modules - shelter roof can fit a maximum of
18modules - south wall of the barn can fit a maximum of
5modules
Power Prediction
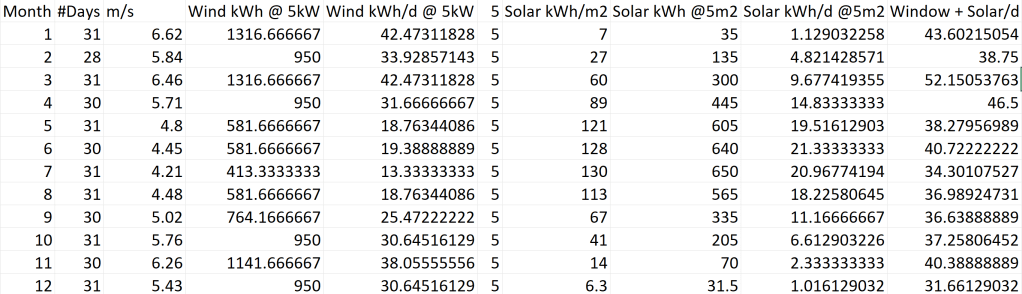
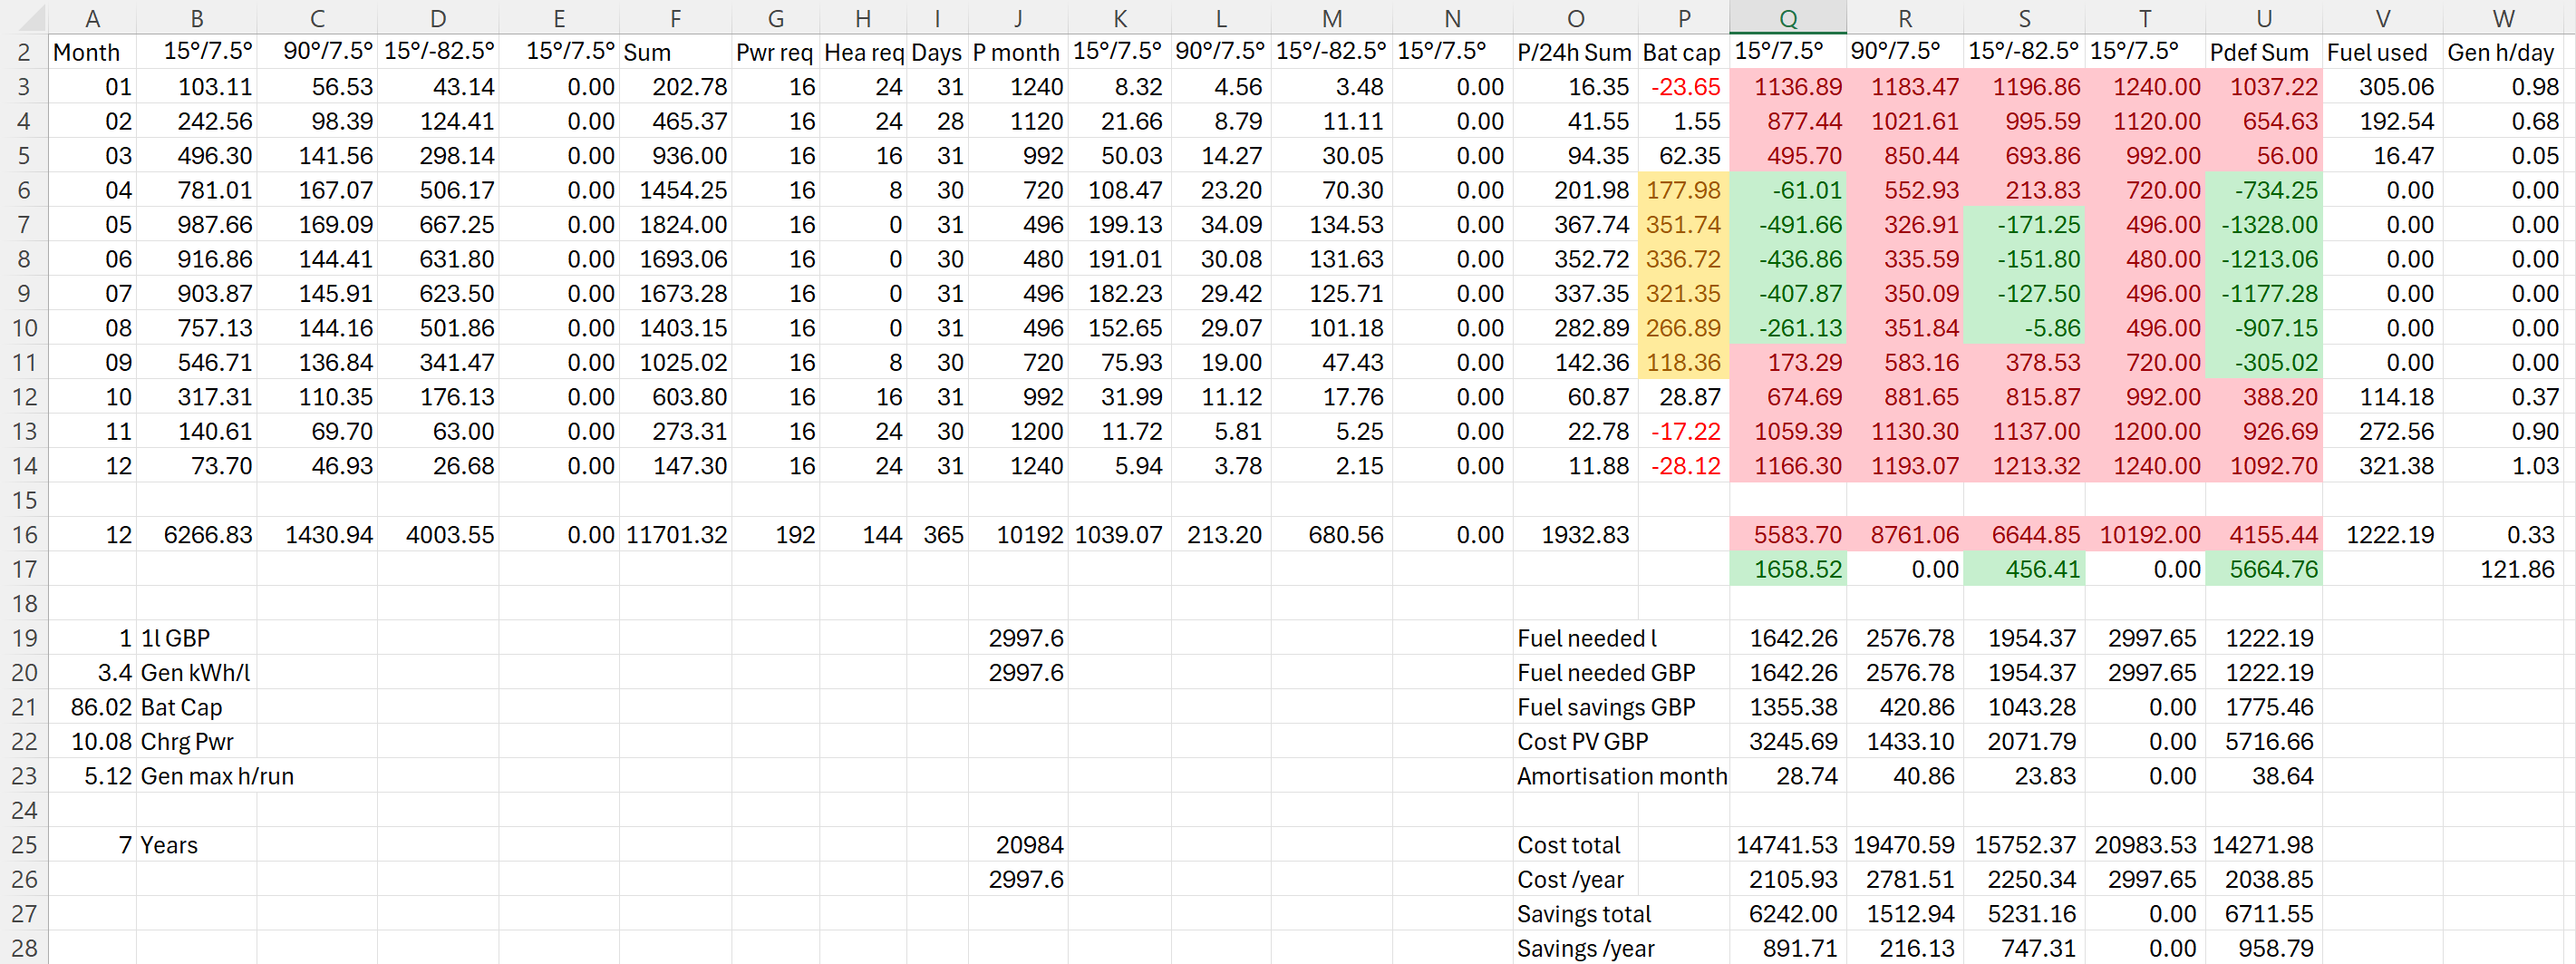
I then combined the info into a table to see if and how much energy could be produced. For this I estimated the amount of energy I would need in the forseeable future per month (electricity and heating) which varies between 480kWh and 1'240kWh.
Note: currently we do not need even 25% of that amount.
The numbers with red background reflect the energy deficit for that month. Numbers with green background show an excess power production for that month. The total of all panels is shown in column U. From there it is compared against our generator which would roughly need 0.3l/kWh (row 26).
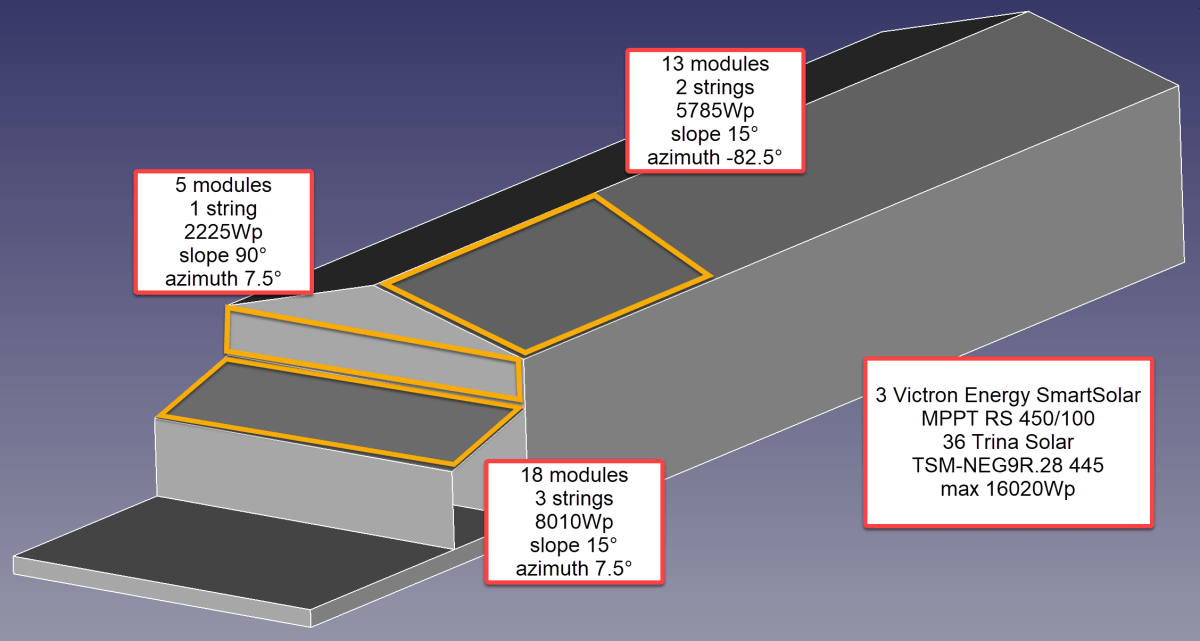
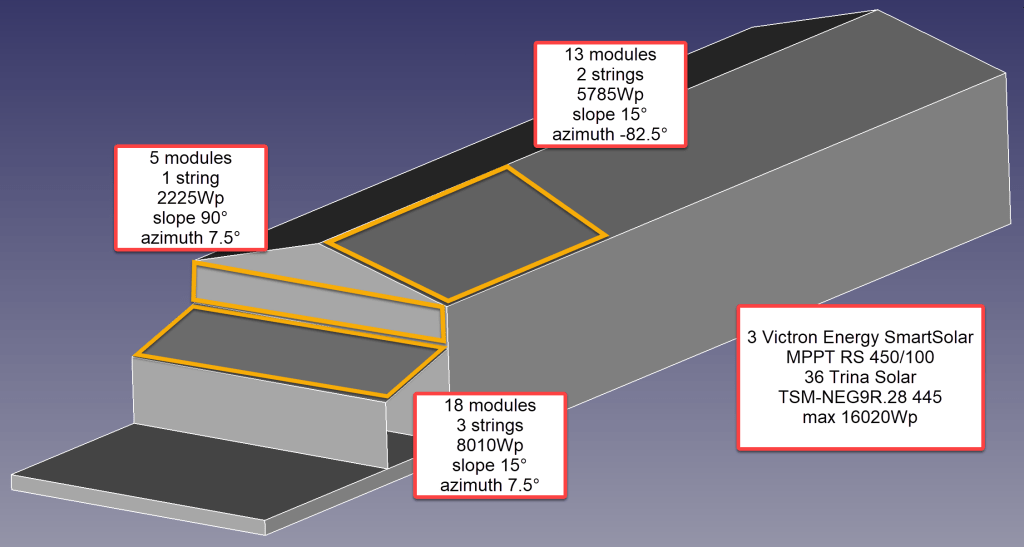
So, for the first part of the installation I will add 36 modules on 6 strings as you can see from the image below.
Anticipating Change
It is interesting to see how a 25% increase of diesel cost changes the picture:
As we still have space for more modules on our east-facing barn roof, I could add another set of (larger) modules. And this would reduce fuel consumption by approx. 20% by deferring the “break even” to 55 months!

But it gets interesting when we take rising fuel cost into account.


With these additional modules we could run the whole winter with only one filling of our diesel tank and thus avoiding a costly refill during the winter season. So, this is something to be considered for the future.
Distributing Modules
Before wrapping it up, I will quickly motivate why I chose three SmartSolar RS 450/100 instead of one SmartSolar RS450/100 and one SmartSolar RS 450/200 and their connetion to the modules. With three instead of only two devices the average power reduction during a failure is only 33% instead of 50%. Power limiting is not such an issue, as the strings will be connected as follows:
- Charger 1
117.3 A min temp / 96.2A max temp
string 1: 5 modules 90°/7.5° south wall
string 2: 7 modules 15°/-82.5° east roof - Charger 2
117.6 A min temp / 96.4A max temp
string 1: 6 modules 15°/-82.5° east roof
string 2: 6 modules 15°/7.5° south roof - Charger 3
117.6 A min temp / 96.4A max temp
string 1: 6 modules 15°/7.5° south roof
string 2: 6 modules 15°/7.5° south roof
Conclusion
I certainly do not know how much energy will really be produced. But it is clear, that I will have excess power in the summer when I do not need it and not enough power in the winter when I need it.
Additionally, I merely save a 950 GBP per year – not taking into account:
- that I already have a required inverters, bus bars etc;
- any labour on my side to design and install the system;
- that the system gets more complex and error prone.
So, in reality I probably do not really save much to anything with this installation, as Diesel is still way too cheap. Though I certainly benefit from that, it is actually a shame. There should be more incentives for cleaner power generation.
As a side note: In case you missed why we went for a generator in the first place., here is why. The quote from the power company for a grid connection was way over 35’000 GBP. For this amount I can easily buy a generator, inverters, batteries and even solar modules.
And I already have an idea what to do with all the energy during the summer months that we really do not need: brewing a red ale with green energy …
Addendum
./.
Corrigendum
./.